Task Manager can show that “something” is using the network. It does not keep a simple chart of received and sent speed for one adapter, and it does not put the adapter’s link speed, address and DNS next to that chart.
Network Monitor in Windows Manager follows the Ethernet or Wi-Fi adapter you select. About once a second it draws Received Data and Sent Data, and it keeps the current rate, the peak, the running average and the adapter’s cumulative total. The line marked Bandwidth is the adapter’s link speed, not the speed of the transfer that is happening right now.
The screenshots below match the real window. Hover the ? at the top right of the status bar for a short tip, then click Online Help under that tip to open this article.
1. What can Network Monitor do?
- Watch one adapter live. Received and sent speed update about once a second for the adapter selected at the bottom of the window.
- Show link bandwidth. The chart subtitle and the Speed row both show the adapter’s link rate, such as 433 Mbps or 1000 Mbps.
- Keep a short history. The chart holds about 60 seconds. The oldest point drops off as a new one is added.
- Summarize the traffic. A table under the chart lists current rate, maximum rate, total and average rate for received data and sent data.
- Open the adapter’s details. Description, connection name, manufacturer, MAC address, IP address, subnet mask, MTU, gateway and DNS sit in a pane on the left.
- Leave it in the notification area. It can start with Windows and hide to the tray when you minimize it. The tray menu opens Windows network settings and common diagnostic commands.
It does not list which program is transferring data. For that, use the Resource Monitor button, which opens Windows Resource Monitor on the Network page. Hardware Monitor can also show upload and download for an adapter, as sensor readings rather than this chart.
2. How to open Network Monitor
In the Windows Manager main window:
Network → Network Monitor
The button description reads “Monitor network traffic and view network configuration”. The window caption is “Windows Manager - Network Monitor” plus the version. Download a trial from the download page if you do not have it yet.
The list contains adapters Windows classifies as Ethernet or Wi-Fi. The first adapter that is already up is selected. If none are up, the first adapter in the list is selected. If the list is empty, Network Monitor says that no network adapters were found and then closes.
3. Status, bandwidth and the chart
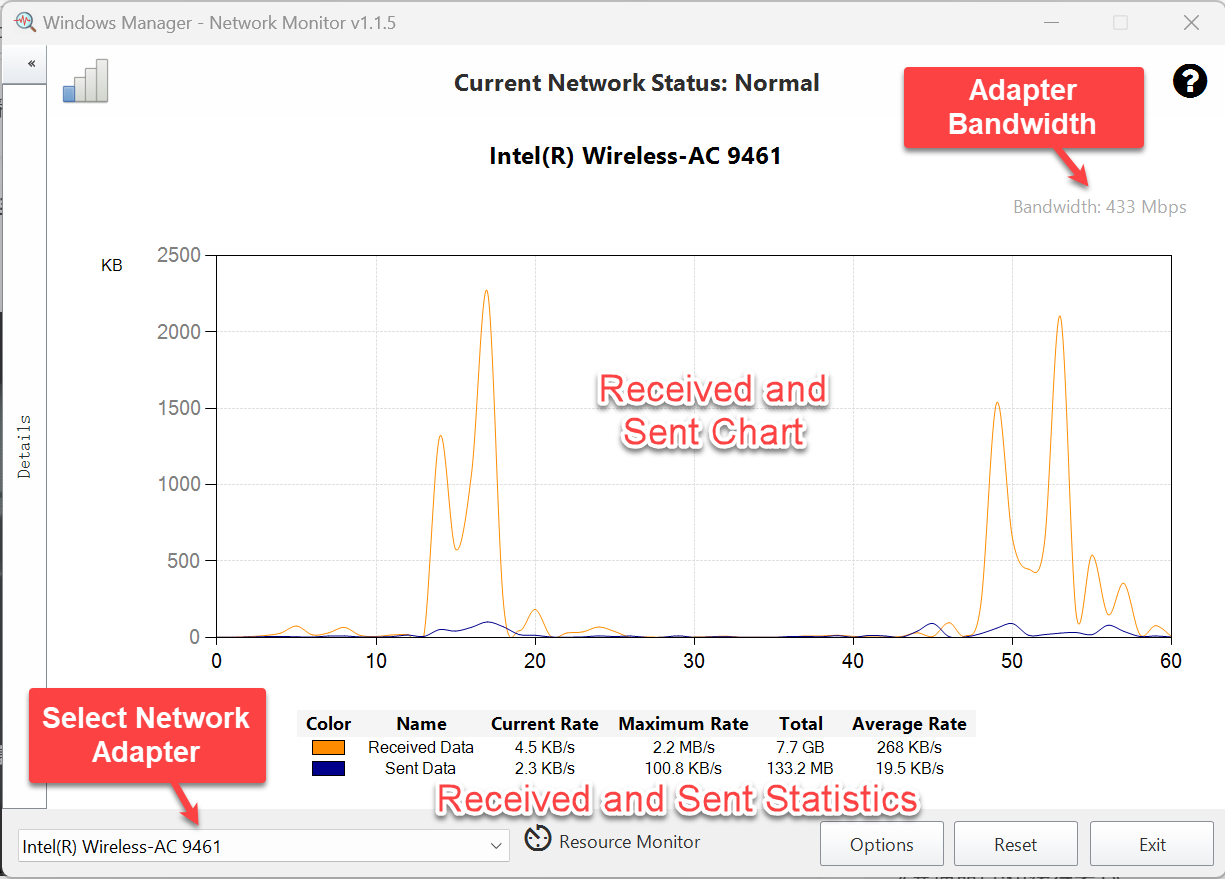
The bar across the top shows Current Network Status and a state such as Normal, Disconnected, Cable Unplugged, Disabled, Down, Connecting, Authenticating or Unknown. On a wired adapter, “media disconnected” is Cable Unplugged. On Wi-Fi, that same condition is Disconnected. The icon at the left of the bar changes with the connection. While the status is normal, it fills in steps as the combined received and sent rate rises toward the link speed.
The chart title is the adapter name. Under it, at the right, is Bandwidth. That number comes from the adapter’s link speed. A speed above 10,000 bits per second is shown in Mbps (the bit rate divided by 1,000,000). A slower link is shown in bps. It does not rise and fall with the file you are downloading.
Two lines share the chart:
- Received Data — traffic coming in. The default color is dark orange.
- Sent Data — traffic going out. The default color is dark blue.
The horizontal axis runs from 0 to 60. A new point is added about once a second, and the oldest point is removed, so you are looking at roughly the last minute. The vertical axis uses the unit chosen in Options. The default is KB. You can switch it to Byte or MB. Values are whole numbers in that unit, so a modest speed can sit on zero when the unit is MB even though the table under the chart still shows the real rate. The default chart type is Spline.
4. Received and sent statistics
The table under the chart has six columns: Color, Name, Current Rate, Maximum Rate, Total and Average Rate. There is one row for Received Data and one for Sent Data.
- Current Rate is the speed from the latest sample, shown per second and scaled automatically (B, KB, MB or GB).
- Maximum Rate is the highest speed seen since you selected this adapter, or since you clicked Reset. It belongs to this visit, not to a long-term history.
- Total is the adapter’s cumulative received or sent byte count from Windows, not “how much has moved since I opened Network Monitor”. It is not cleared by Reset.
- Average Rate is the bytes counted since you selected the adapter (or since Reset), divided by the seconds since that moment.
The table uses the real byte rate. It does not reuse the rounded chart point, so the table and the chart can disagree slightly when the Y-axis unit is coarse.
5. Choose a network adapter
The drop-down at the bottom left lists every adapter whose type is Ethernet or Wireless80211, including a virtual adapter if Windows reports it as Ethernet. Pick the adapter you want to watch. Network Monitor reloads that adapter’s details, clears the chart, and starts the maximum and the average again. Total then shows the cumulative counters for the adapter you just chose.
While the adapter is changing, the list is briefly disabled so a second click cannot start another switch in the middle of the first one.
6. Adapter details
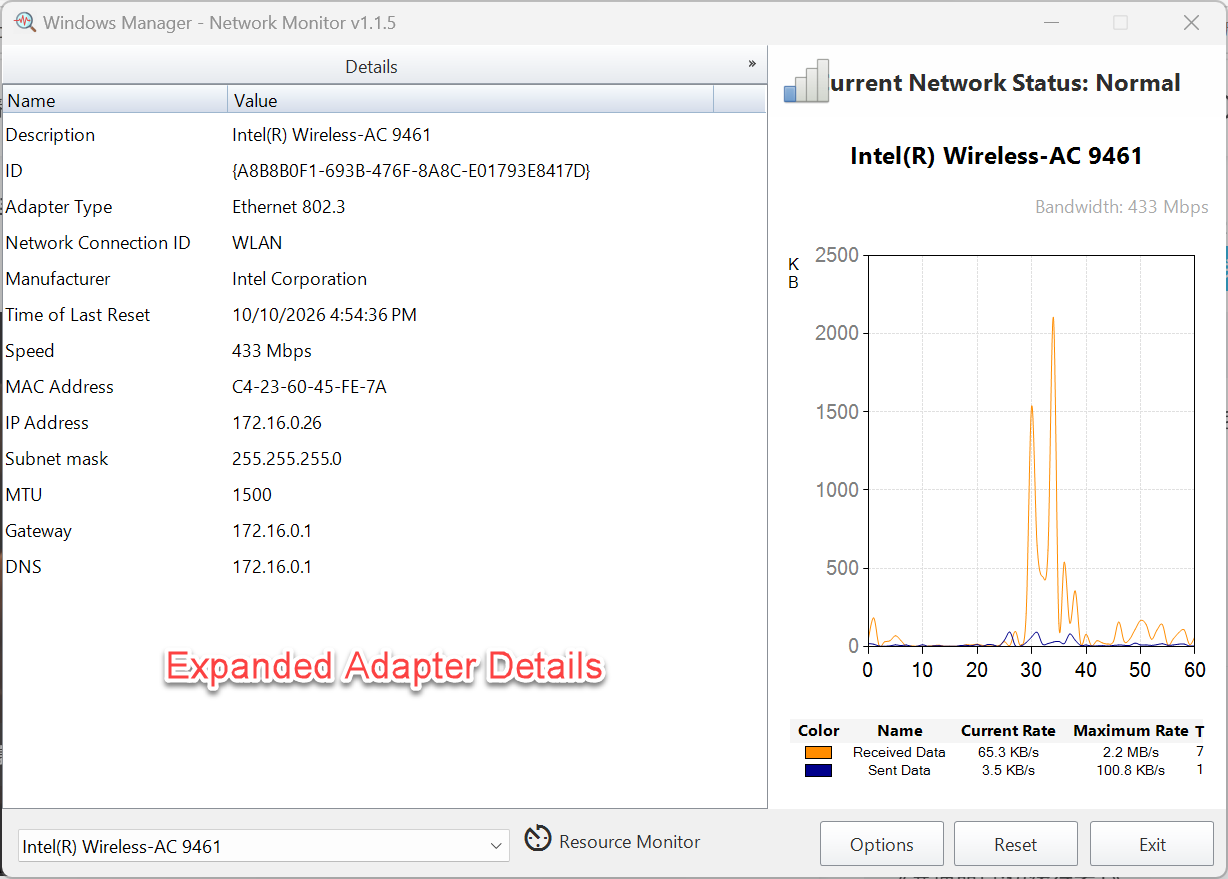
The Details pane starts collapsed on the left. Expand it to read the adapter. The rows are:
- Description and ID (the adapter GUID).
- Adapter Type, Network Connection ID (the name you see in Windows, such as WLAN or Ethernet) and Manufacturer.
- Time of Last Reset — when Windows last reset this adapter’s counters. This is not the time you clicked the Reset button in Network Monitor.
- Speed — the same link bandwidth shown above the chart.
- MAC Address, shown as hexadecimal pairs separated by hyphens.
- IP Address and Subnet mask. More than one address can appear as more than one row. The mask row is the IPv4 mask.
- MTU, Gateway and DNS. Several DNS addresses are joined with a semicolon.
Right-click a row to Copy Selected to Clipboard or Copy All to Clipboard. Click the chart, or the window background, to collapse the pane again.
7. Options
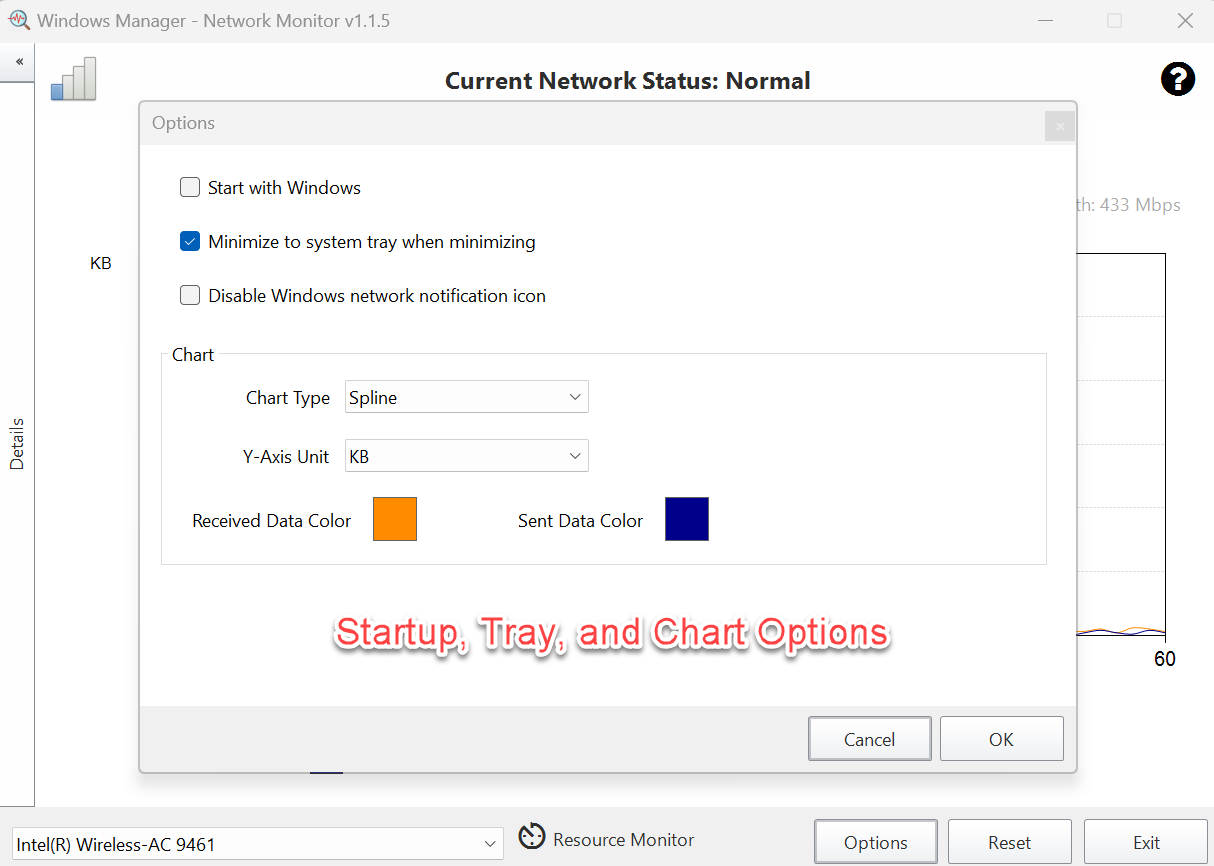
Click Options at the bottom right.
- Start with Windows. Creates a logon task in Task Scheduler, under the Yamicsoft folder, so Network Monitor can start with administrator rights without a UAC prompt. The window opens minimized.
- Minimize to system tray when minimizing. This is on by default. Minimizing hides the window, removes it from the taskbar, and leaves the notification icon. If you clear it, a minimized window stays on the taskbar, and the notification icon is hidden again when the window is restored.
- Disable Windows network notification icon. Hides the Windows network icon in the notification area. It does not hide Network Monitor. Changing this checkbox and clicking OK restarts Windows Explorer so the setting applies.
The Chart group:
- Chart Type. The default is Spline. A few financial chart types are left out because they do not fit a rate graph. Other types from the chart library are listed; a line or area chart is the readable choice for this data.
- Y-Axis Unit. Byte, KB or MB. The default is KB. Changing the unit clears the drawn curve so the scale starts from zero. It does not reset maximum, average or total.
- Received Data Color and Sent Data Color. Click the color swatch and pick a color. Click OK to apply the chart type, the unit and the colors. Cancel closes the dialog without applying a new chart type or unit.
8. Reset, Resource Monitor and Exit
- Reset clears the chart, sets both maximum rates back to zero, and starts the average from the current moment. A notice says “Statistics have been reset.” Total still shows the adapter’s cumulative counters. Details → Time of Last Reset does not change.
- Resource Monitor starts Windows Resource Monitor with the Network page (
resmon.exe /Network). Use it when you need the process, not only the adapter. - Exit closes Network Monitor and removes the notification icon. Minimizing does not exit.
9. Notification area
The tray icon appears when the window is minimized and Minimize to system tray when minimizing is checked. Hover the icon to see the program name and version. Double-click it, or right-click and choose Show, to restore the window. The icon is then hidden.
The right-click menu matches the short help tip:
- Windows settings: Network and Internet, Network Connections, Network Diagnostics, and Windows Defender Firewall.
- Commands, each in its own console window: Ping, PathPing, IPConfig (with
/all), Netsh, Route, Tracert, NSLookup, Netstat, NBTSTAT and Arp. - Wireless: WLAN Profiles and WLAN Interfaces.
- Reset network configuration. This runs
netcfg.exe -d. It resets Windows network components. It is not the Reset button in the Network Monitor window. Use it only when you intend to reset networking. - Flush DNS cache and All MAC addresses.
- Show and Exit.
If a wired adapter loses the network, the chart can be hidden, the window shows “The network is unavailable.”, and sampling pauses until the network returns. A wireless adapter keeps the chart moving. The status text and the icon still update in either case.
10. Notes
- Bandwidth is link speed, not throughput. A 433 Mbps Wi-Fi link can still be transferring only a few KB/s. Read Current Rate for the live speed.
- Only Ethernet and Wi-Fi adapters are listed. Loopback, tunnels and other types stay out unless Windows classifies them as Ethernet or Wi-Fi.
- Total is the adapter counter. It includes traffic from before you opened Network Monitor. Reset does not zero it.
- The chart is about one minute long and samples about once a second. Maximum and average cover the time since you selected the adapter or clicked Reset, not only the points still on the chart.
- A large Y-axis unit hides small speeds on the chart. The table still shows them.
- Rates are for the whole adapter. They are not split by program.
- The Windows network icon option restarts Explorer and affects only that Windows icon.
- Start with Windows opens the window minimized. With the tray option on, you will see the icon rather than the chart until you choose Show.
11. Typical workflow
- Open Network → Network Monitor.
- Check the adapter name in the list. Choose another Ethernet or Wi-Fi adapter if the wrong one was selected.
- Read Bandwidth for the link speed, then the chart and Current Rate for the live received and sent speed.
- After a download or call, look at Maximum Rate. Use Average Rate for the pace since you opened this adapter.
- Expand Details when you need the IP address, gateway or DNS. Right-click a row if you want to copy it.
- Click Options if you want Network Monitor to start with Windows or stay in the tray. Click OK.
- Click Resource Monitor if you need to see which process is using the adapter. Click Exit when you are finished, or minimize if you want the tray icon to remain.
12. FAQ
Is Bandwidth the current download speed?
No. Bandwidth is the adapter link speed reported by Windows, such as 433 Mbps. The live speeds are the Received Data and Sent Data lines, and the Current Rate column.
Which network adapters does Network Monitor list?
Adapters Windows reports as Ethernet or Wi-Fi. It selects the first adapter that is up, or the first adapter in the list if none are up. If there are no such adapters, it says no network adapters were found and closes.
What does the Reset button clear?
The chart, the maximum rates, and the starting point of the average. Total stays on the adapter’s cumulative counters. Time of Last Reset in Details is not updated by this button.
Does “Disable Windows network notification icon” hide Network Monitor?
No. It hides the Windows network icon. Network Monitor’s own tray icon is unchanged. Explorer restarts when you change that checkbox and click OK.
Try it now
Network Monitor sits with the other network tools in Windows Manager. Wi-Fi Manager is for saved wireless profiles. Hardware Monitor is for temperatures, load and other sensors. More tools are on the product page.
Get started: Download Windows Manager — open Network → Network Monitor, confirm the adapter, and read the received and sent speed next to the link bandwidth.
