When a PC suddenly slows down, the fans roar, or a game starts stuttering, the cause is often overheating or a component running at full load. Task Manager only shows rough CPU, memory and disk usage—it cannot show per-core CPU temperatures, graphics card power draw, or how much life your SSD has left.
Hardware Monitor in Windows Manager automatically detects the processor, memory, graphics card, drives, network adapters, mainboard and battery in your PC, and gathers their sensor readings—temperature, load, clock, power, voltage, fan speed, data volume, transfer rate and more—into one tree. Readings refresh every second, and both the Current and Maximum value of each sensor are recorded. In Options you can also turn on a high-temperature alarm that shows a notification, optionally with a sound, when a temperature exceeds your limit.
Below: how to open it, how to read each hardware category, how to set the alarm and run it in the background, and what to watch for. Screenshots match the real window. Hover over the ? icon at the bottom right of the program for a short tip, then click Help Online at the bottom of the tip to open this article.
1. What can Hardware Monitor do?
- See all your hardware at a glance. Automatically lists the computer name, mainboard, CPU, physical memory, virtual memory, graphics cards, every hard drive/SSD and network adapter—plus the battery on laptops.
- Check temperatures in real time. CPU package and per-core temperatures, GPU temperatures, drive temperatures and more, in °C, updated every second.
- Check load and usage. Load of every CPU thread, CPU Total, memory usage, GPU engine load (3D, video decode and more), and network utilization.
- Check clocks, power and voltage. CPU/GPU clock speeds (MHz), power (W), voltage (V), and mainboard fan speeds (RPM).
- Understand drive health. SSD remaining life, available spare, total data read/written, power-on count and power-on hours, free space and more.
- Record peaks. The Maximum column keeps the highest valid value of each reading since the program started—ideal for checking peak temperature and load after gaming, rendering or a stress test.
- Temperature alarm and background monitoring. Set a temperature limit and alarm sound, start with Windows and minimize to the system tray to watch your hardware around the clock.
It complements Process Manager: Process Manager tells you which program is using resources; Hardware Monitor tells you how hot and how busy the hardware itself is.
2. How to open Hardware Monitor
In the Windows Manager main window:
Information → Hardware Monitor
The button description reads “Monitor hardware parameters and status in real-time”. It opens as a separate window (caption “Windows Manager - Hardware Monitor”). The first launch needs to detect your hardware, so an initializing window appears briefly. Download a trial from the download page if needed. Some mainboard, fan and voltage sensors require elevated rights, so running Windows Manager as administrator is recommended.
3. Main window
The window has a sensor tree on top and a toolbar at the bottom:
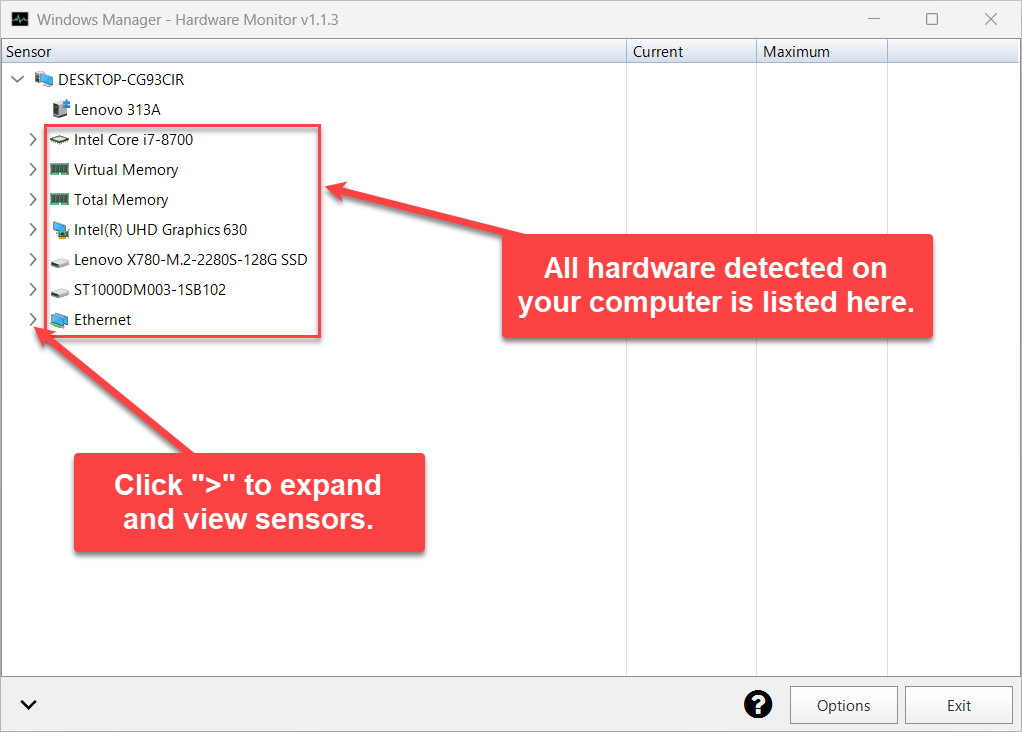
- Sensor tree: the root node is your computer name, and each child node is a hardware component. Expand a component to see its sensors grouped by type (such as Load, Temperature, Clock, Power, Data, Transfer Rate), then expand a group to see the individual sensors.
- Three columns: Sensor (name), Current (refreshed every second) and Maximum (highest value since the program started). Column widths can be dragged; the program remembers column widths and window size when it closes.
- Expand/collapse button (bottom left): expands or collapses all nodes in one click. Nodes you expand by hand are remembered too, so the tree opens the same way next time.
- Bottom-right buttons: ? (hover for a short tip and the Help Online link), Options and Exit.
Click “>” to the left of a component to expand it and view all its sensors.
4. Memory and virtual memory
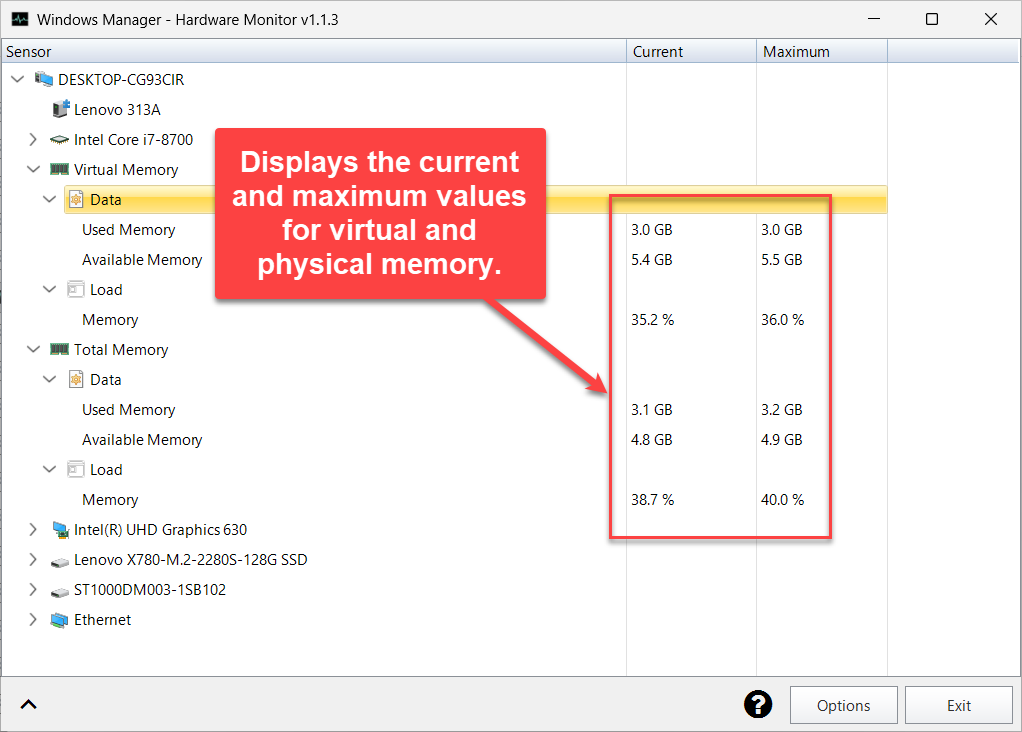
Expand Total Memory and Virtual Memory to see:
- Data group: Used Memory and Available Memory (GB).
- Load group: Memory usage (%).
Total Memory reflects the RAM installed on the mainboard; Virtual Memory includes the page file, so its values are usually larger. If physical memory usage stays above about 85% for long periods, memory is tight—close programs you are not using or consider adding RAM. Some PCs also list individual memory modules with details such as Memory Module Capacity.
5. Processor (CPU): temperature, load and clock
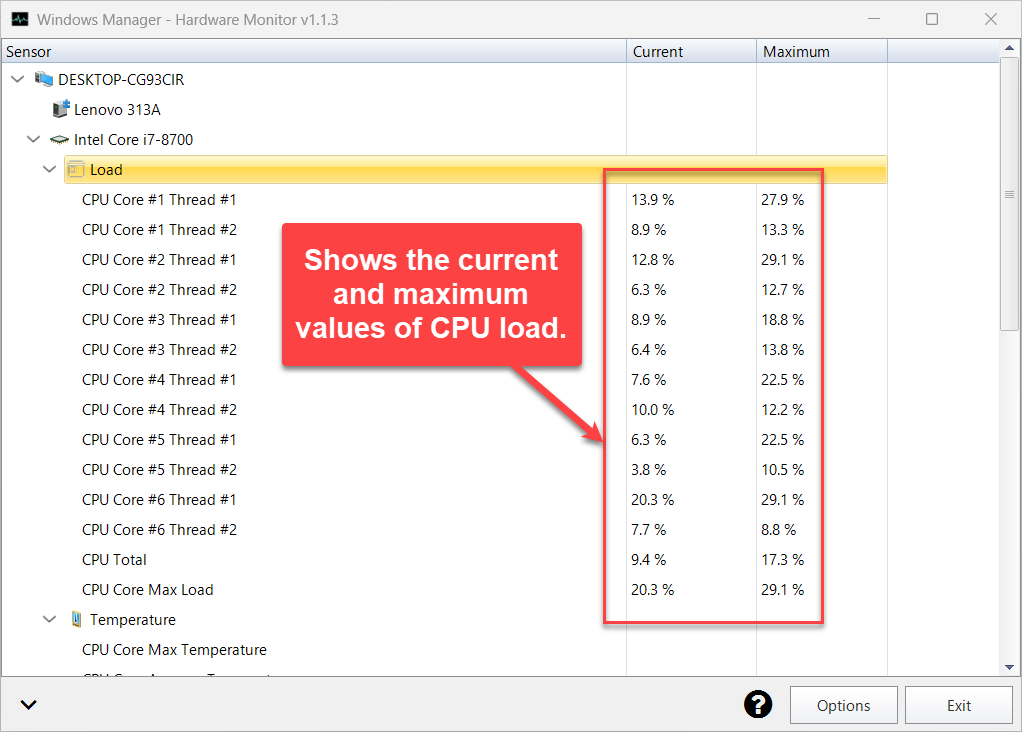
Expand the CPU node (for example Intel Core i7-8700). Common groups include:
- Load: load of every core and thread (such as “CPU Core #1 Thread #1”), plus CPU Total and CPU Core Max Load.
- Temperature: CPU package temperature, per-core temperatures, CPU Core Max Temperature and CPU Core Average Temperature. Some processors also show Distance to TjMax—how many degrees remain before thermal throttling (the smaller the number, the hotter the CPU).
- Clock: per-core clock and bus speed (MHz); some processors also show effective clock and average core clock.
- Power / Voltage: CPU package, core and memory controller power (W), and core voltage (V).
To judge whether the CPU is overheating, focus on the Maximum column of the package temperature and Core Max Temperature. Everyday use is typically 40–70 °C; if it goes above 80 °C under full load, check your cooling (dust, thermal paste, airflow).
6. Graphics card (GPU): load, video memory and power
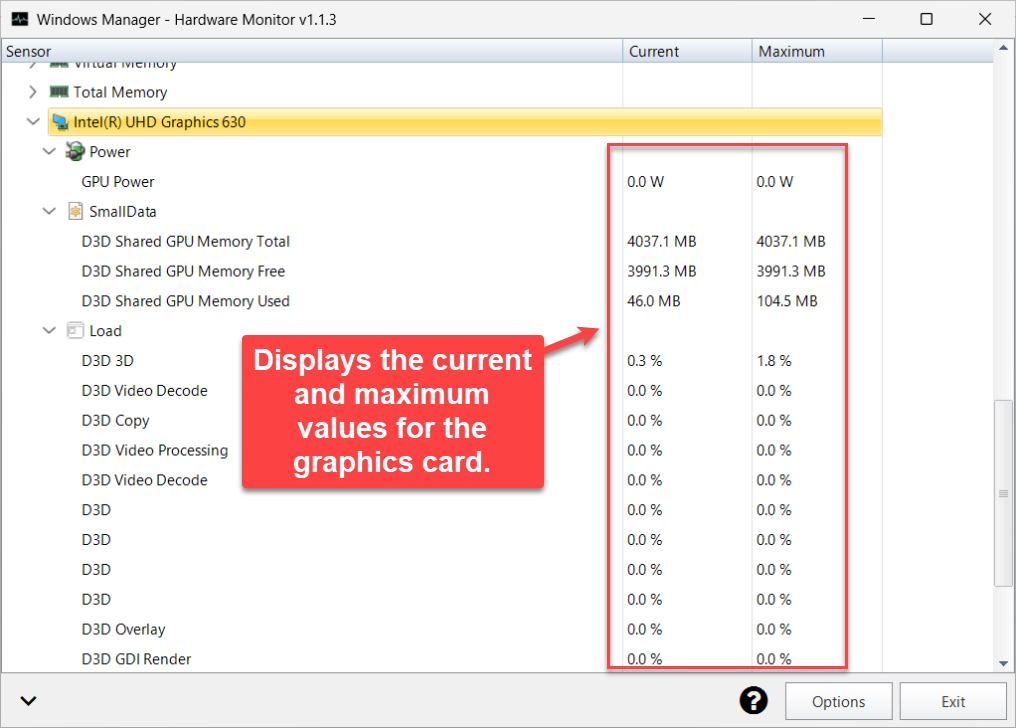
NVIDIA, AMD and Intel graphics (including integrated graphics) are supported. After expanding the graphics card, depending on model and driver you may see:
- Power: GPU Power, board power and similar (W).
- SmallData: total, free and used D3D dedicated / shared GPU memory (MB).
- Load: usage of each engine—D3D 3D, Video Decode, Video Encode, Video Processing, Copy—and, on dedicated cards, GPU Core and GPU Memory Controller load.
- Temperature / Fan / Clock: dedicated cards usually report GPU Core temperature, Hot Spot, Memory Junction, GPU fan speed and core/memory clocks.
While gaming or editing video, keep the window on a second screen or minimized; afterwards, check the Maximum column to see whether peak GPU temperature and load look normal.
7. Hard drives and SSDs: health status
Each hard drive or SSD has its own node. For an NVMe SSD, common sensors are:
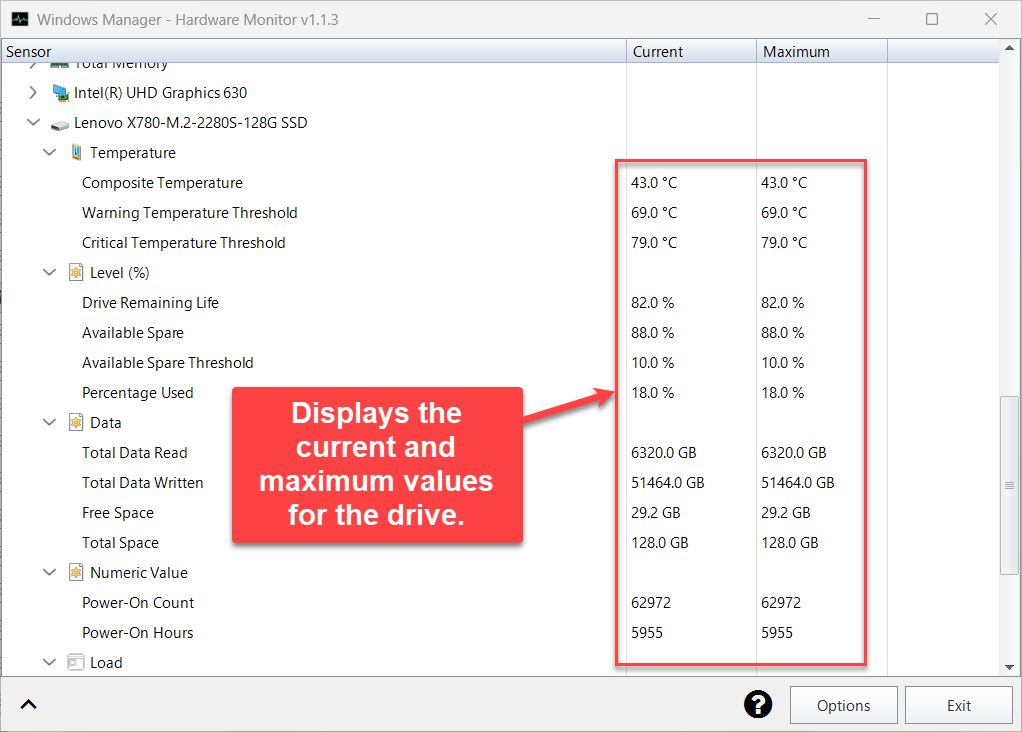
- Temperature: Composite Temperature, plus the drive’s own Warning Temperature Threshold and Critical Temperature Threshold. The last two are fixed values set by the manufacturer for comparison—they are not live temperatures.
- Level (%): Drive Remaining Life, Available Spare, Available Spare Threshold and Percentage Used.
- Data: Total Data Read, Total Data Written, Free Space and Total Space (GB).
- Numeric Value: Power-On Count and Power-On Hours.
- Load: Used Space and disk read/write/total activity (%); some drives also report read and write rates.
The lower an SSD’s remaining life and the more data written, the more worn it is. When remaining life drops to around 10% or Available Spare approaches its threshold, back up important data and plan a replacement. Hard disk drives usually expose fewer sensors—mainly temperature and space used.
8. Network adapters: traffic and speed
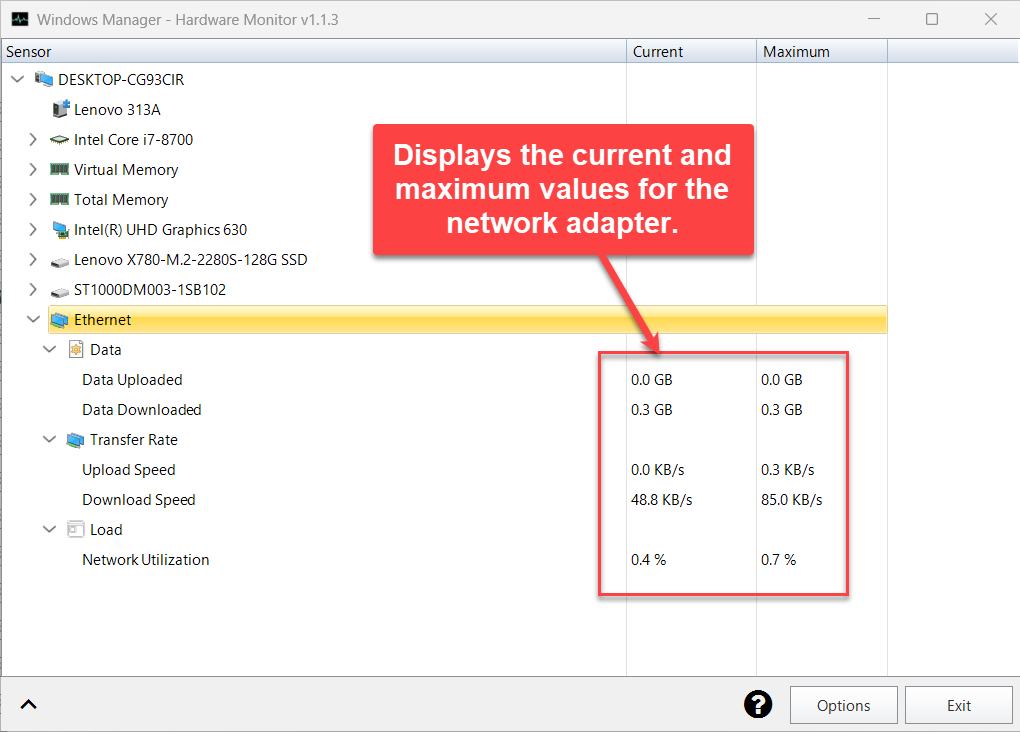
Every connected network adapter (Ethernet, Wi-Fi, etc.) lists:
- Data: Data Uploaded and Data Downloaded (GB).
- Transfer Rate: Upload Speed and Download Speed (KB/s or MB/s, converted automatically).
- Load: Network Utilization (%).
The Maximum download/upload speed helps you judge your connection’s real peak. If upload speed stays high while the PC is idle, use Process Manager to find which program is using the network.
9. Mainboard, fans and battery
- Mainboard: if the mainboard has a recognized monitoring chip (Super I/O or embedded controller), it shows mainboard temperatures, Voltage rails, Fan speeds (RPM) and Fan Control percentages.
- Battery (laptops): charge level, degradation level, designed capacity, fully-charged capacity, remaining capacity, charge/discharge current and rate, estimated remaining time, battery temperature and more.
- Other devices: some liquid coolers, power supplies and power monitors are also listed once recognized.
Which sensors appear depends on the hardware and on whether its driver provides the data. An empty reading usually means the hardware does not support it or has no valid data at the moment—not that the program is malfunctioning.
10. Options and the high-temperature alarm
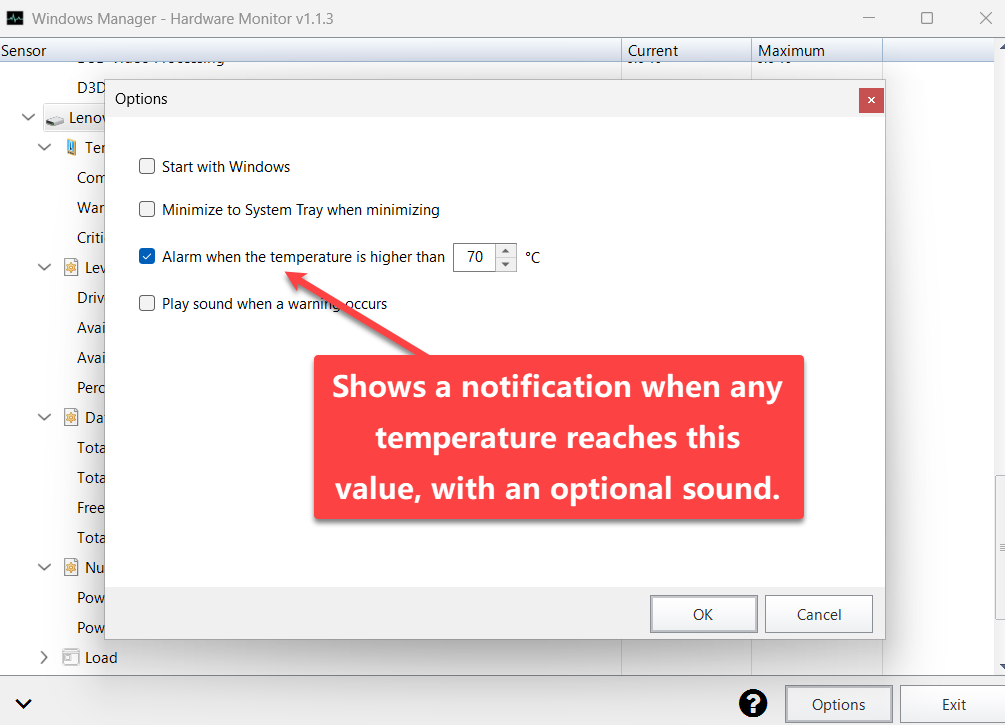
Click Options at the bottom right to open the settings dialog (monitoring pauses while it is open and resumes when you close it):
- Start with Windows: runs Hardware Monitor automatically when you sign in to Windows (via Task Scheduler). It starts minimized so it does not get in your way.
- Minimize to System Tray when minimizing: minimizing hides the window and leaves only an icon in the notification area.
- Alarm when the temperature is higher than N °C: set the alarm temperature (default 70 °C, minimum 60 °C). When the current value of any real-time temperature sensor reaches it, Windows shows a notification with the hardware name and current temperature. Fixed reference values—drive warning/critical temperature thresholds, memory temperature limits, Distance to TjMax and similar—are ignored to avoid false alarms.
- Play sound when a warning occurs: plays a sound together with the alarm notification; available only when the temperature alarm is on.
Click OK to save, or Cancel to discard your changes.
11. System tray and background monitoring
To let Hardware Monitor guard temperatures in the background, check Start with Windows, Minimize to System Tray when minimizing and Alarm when the temperature is higher than together:
- After minimizing, only the tray icon remains; hover over it to see the program name and version.
- Double-click the tray icon, or right-click and choose Show, to restore the window.
- Right-click and choose Close, or click Exit in the window, to quit completely—monitoring and alarms stop as well.
12. Notes
- Maximum values cover the current session only. Peaks are cleared when the program exits and recording starts over the next time. Invalid or abnormal readings are not counted.
- Sensors vary by hardware. Different CPUs, graphics cards, mainboards and drives expose very different sets of sensors; a missing reading is normal. Updating the mainboard BIOS or graphics driver may add readings.
- Run as administrator. Reading low-level data such as mainboard monitoring chips, fans and voltages requires elevated rights; without them those nodes may be missing.
- Avoid running several monitoring tools at once. Multiple hardware monitors accessing the same sensor chip can cause jumping or empty readings.
- Drive thresholds are not live temperatures. Warning Temperature Threshold and Critical Temperature Threshold are the manufacturer’s upper-limit references, and the temperature alarm does not trigger on them. Use live readings such as Composite Temperature to judge whether a drive is overheating.
- Choose a sensible alarm temperature. A limit that is too low causes frequent notifications; 75–85 °C is a common range—adjust it to your hardware’s normal temperatures.
- Closing the window stops monitoring. For continuous alarms, minimize to the system tray instead of clicking Exit.
- Readings are for reference. Values come from hardware sensors, and accuracy depends on the hardware itself. If you see abnormally high temperatures, check cooling first and avoid long periods of full load at high temperature.
13. Typical workflow
- Windows Manager main window → Information → Hardware Monitor.
- Click the bottom-left button to expand all nodes and browse the Current values of the CPU, graphics card, memory, drives and network adapters.
- Run a game, render or stress test for a while, then come back and check peak temperature and load in the Maximum column.
- Expand your SSD to check Drive Remaining Life, Total Data Written and Power-On Hours.
- Click Options, check Alarm when the temperature is higher than and set a suitable temperature; optionally enable the sound, Start with Windows and Minimize to System Tray, then click OK.
- Minimize the window and let Hardware Monitor keep watching your hardware from the system tray.
Try it now
Hardware Monitor sits with Windows Manager’s other system information and maintenance tools. See the product page for more; to find programs that use resources, pair it with Process Manager; to trim startup items and reduce background load, try Startup Manager.
Get started: Download Windows Manager — open Information → Hardware Monitor, check your current CPU and GPU temperatures, then turn on the high-temperature alarm if you need it.
